


Team Name & Logo
Date

Storytelling Presentation (Your Pitch)
Everyone loves to hear stories. So tell an exciting story about your idea!

Storytelling
• You want to start with a story that draws people in and incapsulates why the topic is important
to you
• Storytelling allows us to talk WITH people, rather than just talk TO them, and allows us to
create connections, People not only need to understand your idea, but they need to “feel” it.
• The story should thread through the entire presentation: A good beginning, middle and end. At
the close, wrap up your story.
• The Set Up
• The Struggle
• The Solution
• You may wish to get the storyline straight first using Post-its
5

Pitch Presentation Components

Pitch Presentation Components
• Problem Articulation
• Current Available Solutions
• Your Solution (MVP)
• Implementation Cost
• Scalability
• The Team & Close
• Questions
7

Problem Articulation- Begin Telling the Story
• WHAT IS THE PROBLEM OR UNMET NEED YOU ARE SOLVING?
• How you describe the problem is one of the most important components to a pitch. Tell us the
problem through storytelling. Bring the audience straight into the story.
• Talk about the problem that generated your idea, what motivated your project, and how it is part of
your life and/or your group’s. This kind of information generates empathy and is the first step to grab
their attention
• Don’t assume we know anything, even if we are all nurses. Explain the problem in detail, step by
step.
• What is the problem/pain point you are trying to address? What does it cause? Who feels the pain point?
• Engage and draw the audience in and make them feel like they are solving the problem with you.
• HOW BIG IS THIS PROBLEM (Scope)? HOW MANY PEOPLE DOES IT AFFECT?
• Data helps here if you can find the right information.
• Example: if I am going to tell the audience about the problem with patient falls, I would want to let
them know the volume of hospital falls costs $53 Billion dollars/year nationally.
8

Currently Available Solutions
• Current Solutions = Current Problems and/or Significant Inefficiencies?
• You should research what is currently on the market to solve your problem. If there are
solutions currently available, then make it clear what the issues are, so you can show how
your solution differs and excels.
• The current solutions will be your competitors, so knowing your competitive set well will
enable you to better compete.
• If no current solutions exist, make that clear.
9

Your Solution
• Describe your proposed solution. Go in detail how your solution works and have a Minimally
Viable Product (MVP) to demo
• Convince the judges why your solution is superior. Simplify your story – what are the THREE
things you want the audience to remember?
• Speak to any regulations surrounding this solution or barriers you may encounter, but have a
plan
• Consider creating a grid to show what current solutions do and how your idea differs. This
provides a very effective visual (see slides 11 and 12 for examples)
10
Benefits Our Solution Competitor 1 Competitor 2 Competitor 3 Competitor 4
Intuitive to Use X
Cost to Use Free
$X
Subscription
Platform Microsoft Zoom
Users
Patients/Families/
Clinicians
Clinicians
only
11
EXAMPLE 1 – Our Solution vs. The Competition
Benefits Our Solution Competitor 1 Competitor 2 Competitor 3 Competitor 4
Intuitive Design
Cost
Performance
Quality
Complexity
Overall
Assessment
5 3 2 2 1
12
EXAMPLE 2 – Our Solution vs. The Competition

Implementation Cost
• Although we don’t expect a full business plan, your team should think about implementation
cost and who is going to pay for the solution.
• Will it be the patient? Insurance Company? Hospital system etc.
• Try to understand your costs to build your solution, which will in turn, inform you of what the
costs will need to be.
• How will you penetrate the market? Who are the key market influencers/decision makers that
you need to target or consider?
13

Scalability
• When devising a solution, you should always think about your target population and give it
some thought as to how the solution can be scaled and implemented everywhere not just at
your institution (this can happen later, of course, but be prepared to answer the question).
• Are there other case uses for your solution?
• What do you need to be successful?
• Who else needs to be involved to implement your solution?
14

The Team & Close
Bring the story you opened with full circle.
Close the pitch– why do you think this is a great idea? Remind the audience what they have seen
– no more than three points.
Introduce your team members and discuss skill sets brought to the team that strengthens the
solution. By now the audience understands your proposed solution so they can connect the skill
sets. Include contact Info: Name/Email
Many investors will invest if they like the team and find the team inspiring and passionate.
Try to anticipate the judges questions so you can answer them, however, if you have done your
homework, you will be prepared.
Finally, practice, practice, practice! Getting all important points across in 3 minutes!
15

Good Luck & Good Pitching!
–
From NurseHack4Health Organizers

Use if helpful
Additional charts, process, timeline
templates

Subtitle in Arial Regular, 20 pt.
Slide Title in Arial Bold, 30 pt. Black
18
Use this template for two columns of
text, two images, or to pair text with a
cropped image. If there is only one
chunk of copy, consider getting rid of
the bullets.

Subtitle in Arial Regular, 20 pt.
Slide Title in Arial Bold, 30 pt. Black
19
• In some cases, the image will sit to
the left of the text.
• Make sure whichever you choose,
it is consistent throughout your
presentation.

Subtitle in Arial Regular, 20 pt.
Slide Title in Arial Bold, 30 pt. Black
20
• Bulleted copy spans two columns, to the right
of a single-column image.
• In this scenario, image should usually be on
the left.

Subtitle in Arial Regular, 20 pt.
Slide Title in Arial Bold, 30 pt. Black
21
or text with imagery or just imagesThree columns of text

Subtitle in Arial Regular, 20 pt.
Slide Title in Arial Bold, 30 pt. Black
22
or text with imagery or just imagesThree columns of text

“Use this template
to add extra emphasis
to a quote, fact
or statistic.”
– Attribution

“Use this template
to add extra emphasis
to a quote, fact
or statistic.”
– Attribution

“Use this template
to add extra emphasis
to a quote, fact
or statistic.”
– Attribution

Extending past 6 colors
Bar Chart Example
26
Manually select colors from
palette to complete the chart.
When using bar charts, retain
a minimum distance of 50%
between data points.
0% 10% 20% 30% 40% 50% 60% 70% 80%
Series 1
USA
Canada
Australia
France
Korea
Brazil
Sweden
Chile

Align elements to the grid and enhance the size of key.
Stacked Column Example
27
% to Sales
2006 25.7%
2007 26.0%
2006 2007
$14.6B
$15.9B
$5.7
$6.0
$6.9
$7.6
$2.0
$2.3
MD&D
Consumer
Pharmaceuticals
Subhead Subhead
Your body copy goes here. Body copy goes here. Body copy
goes here. Body copy goes here.
Your body copy goes here. Body copy goes here. Body copy
goes here. Body copy goes here.
Describe your statistic here. This is where the text goes, in
Arial15pt font.
Describe your statistic here. This is where the text goes, in
Arial 15pt font.
1 in 5 3 in 5
Subhead Subhead
• Your first bullet point
can go here.
• This is where your
second bullet point will
go.
• Your first bullet point
can go here.
• This is where your
second bullet point will
go.
Your content
relating to the
pie chart can go
here.
31%
Your content
relating to the
pie chart can go
here.
22%
Compare/Contrast Example
28

Subhead1 Subhead 2 Subhead 3
Put your body copy for
subhead one here. You
can divide into
paragraphs, if needed.
This is where the body
copy goes. This is where
the body copy goes. This
is where the body copy
goes.
Put your body copy for
subhead one here. You
can divide into
paragraphs, if needed.
Put your body copy for
subhead one here. You
can divide into
paragraphs, if needed.
This is where the body
copy goes. This is where
the body copy goes. This
is where the body copy
goes. This is where the
body copy goes. This is
where the body copy
goes. This is where the
body copy goes.
Put your body copy for
subhead one here. You
can divide into
paragraphs, if needed.
This is where the body
copy goes. This is where
the body copy goes.
Subhead 4
4 Column Organization
29
Subtitle in Arial Regular, 20 pt.
Pyramid Example
30
Manually select colors from
palette to complete the chart.
Include any explanatory
information here.
Level 5
Your Content Here
Level 4
Your Content Here
Level 3
Your Content Here
Level 2
Your Content Here
Level 1
Your Content Here

Title
Name Lastname
31
Write a short biography here…
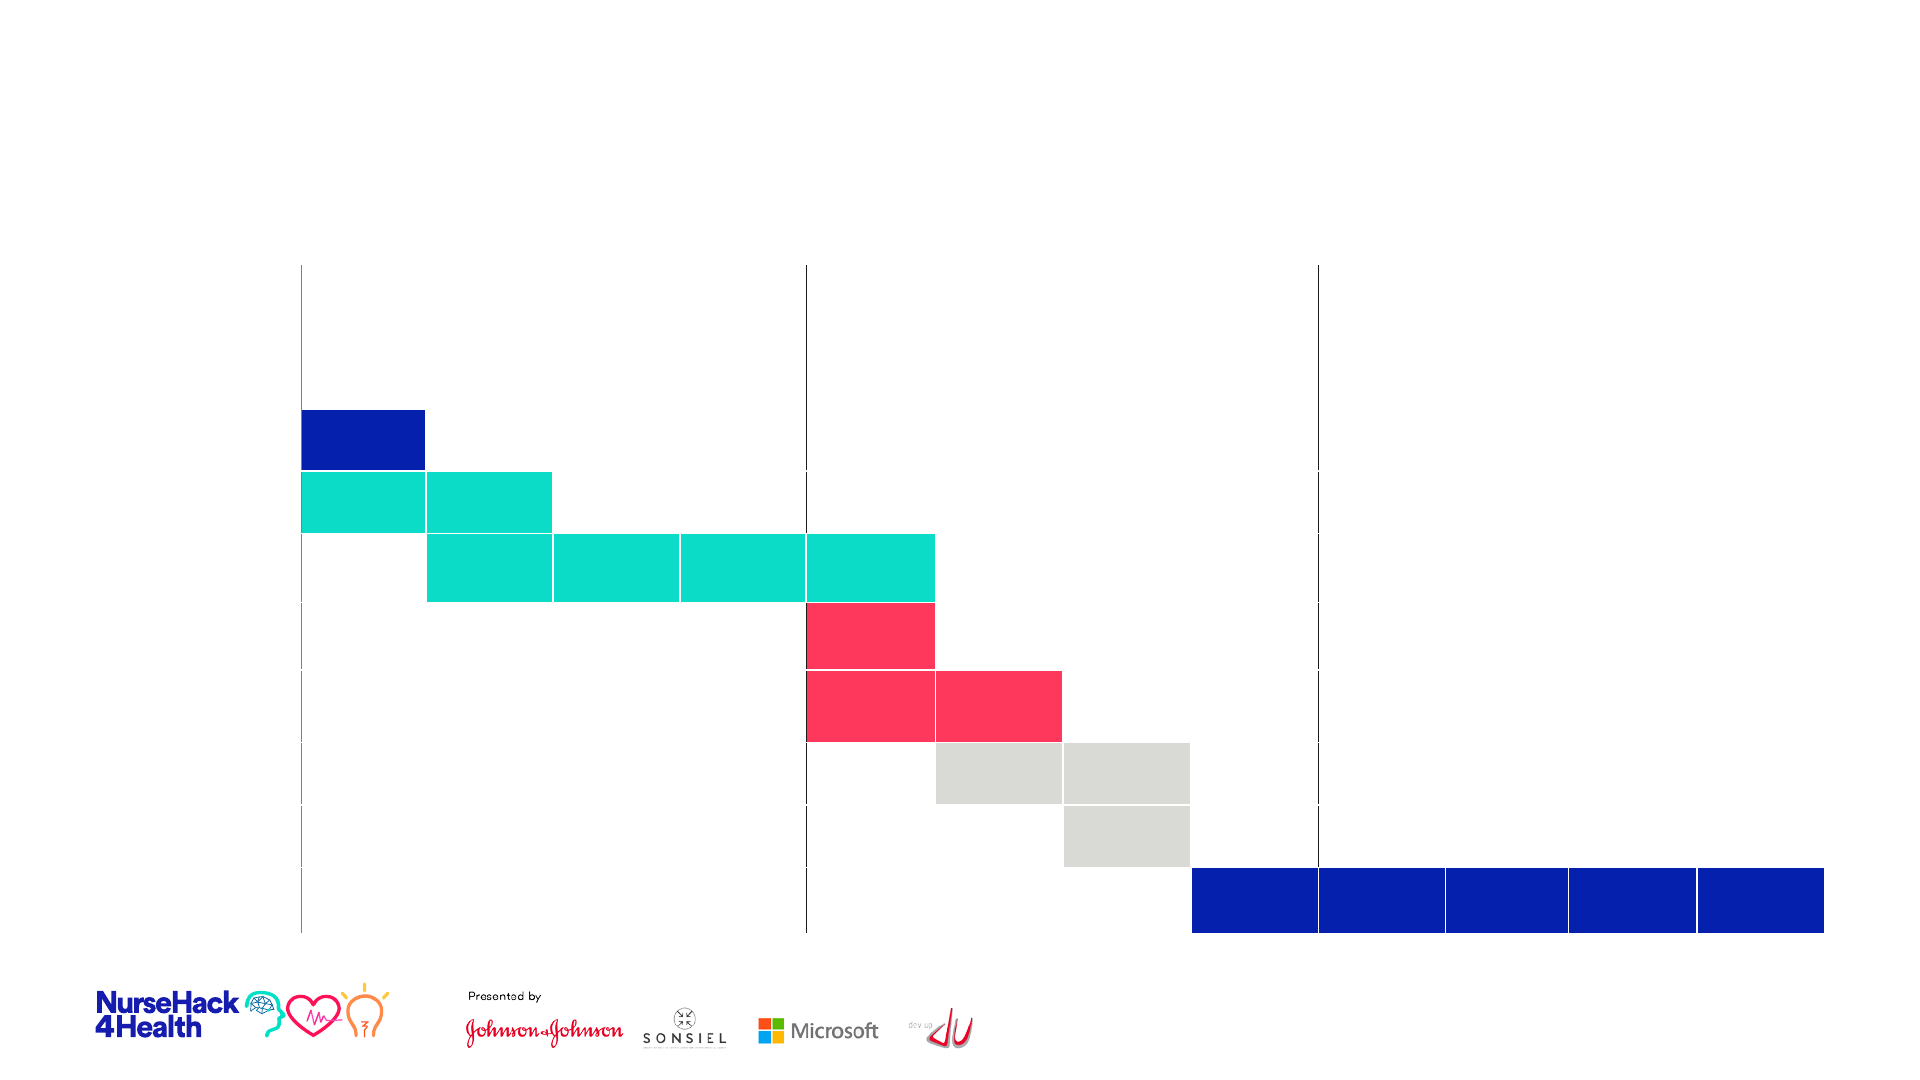
August
September October
Week 1 Week 2 Week 3
Week 4
Week 1 Week 2
Week 3
Week 4 Week 1 Week 2
Week 3
Week 4
Task Title 1
Task Title 2
Milestone
Task Title 3
Task Title 4
Milestone
Task Title 5
Task Title 6
Task Title 7
Milestone
Task Title 8
Milestone
32
Timeline
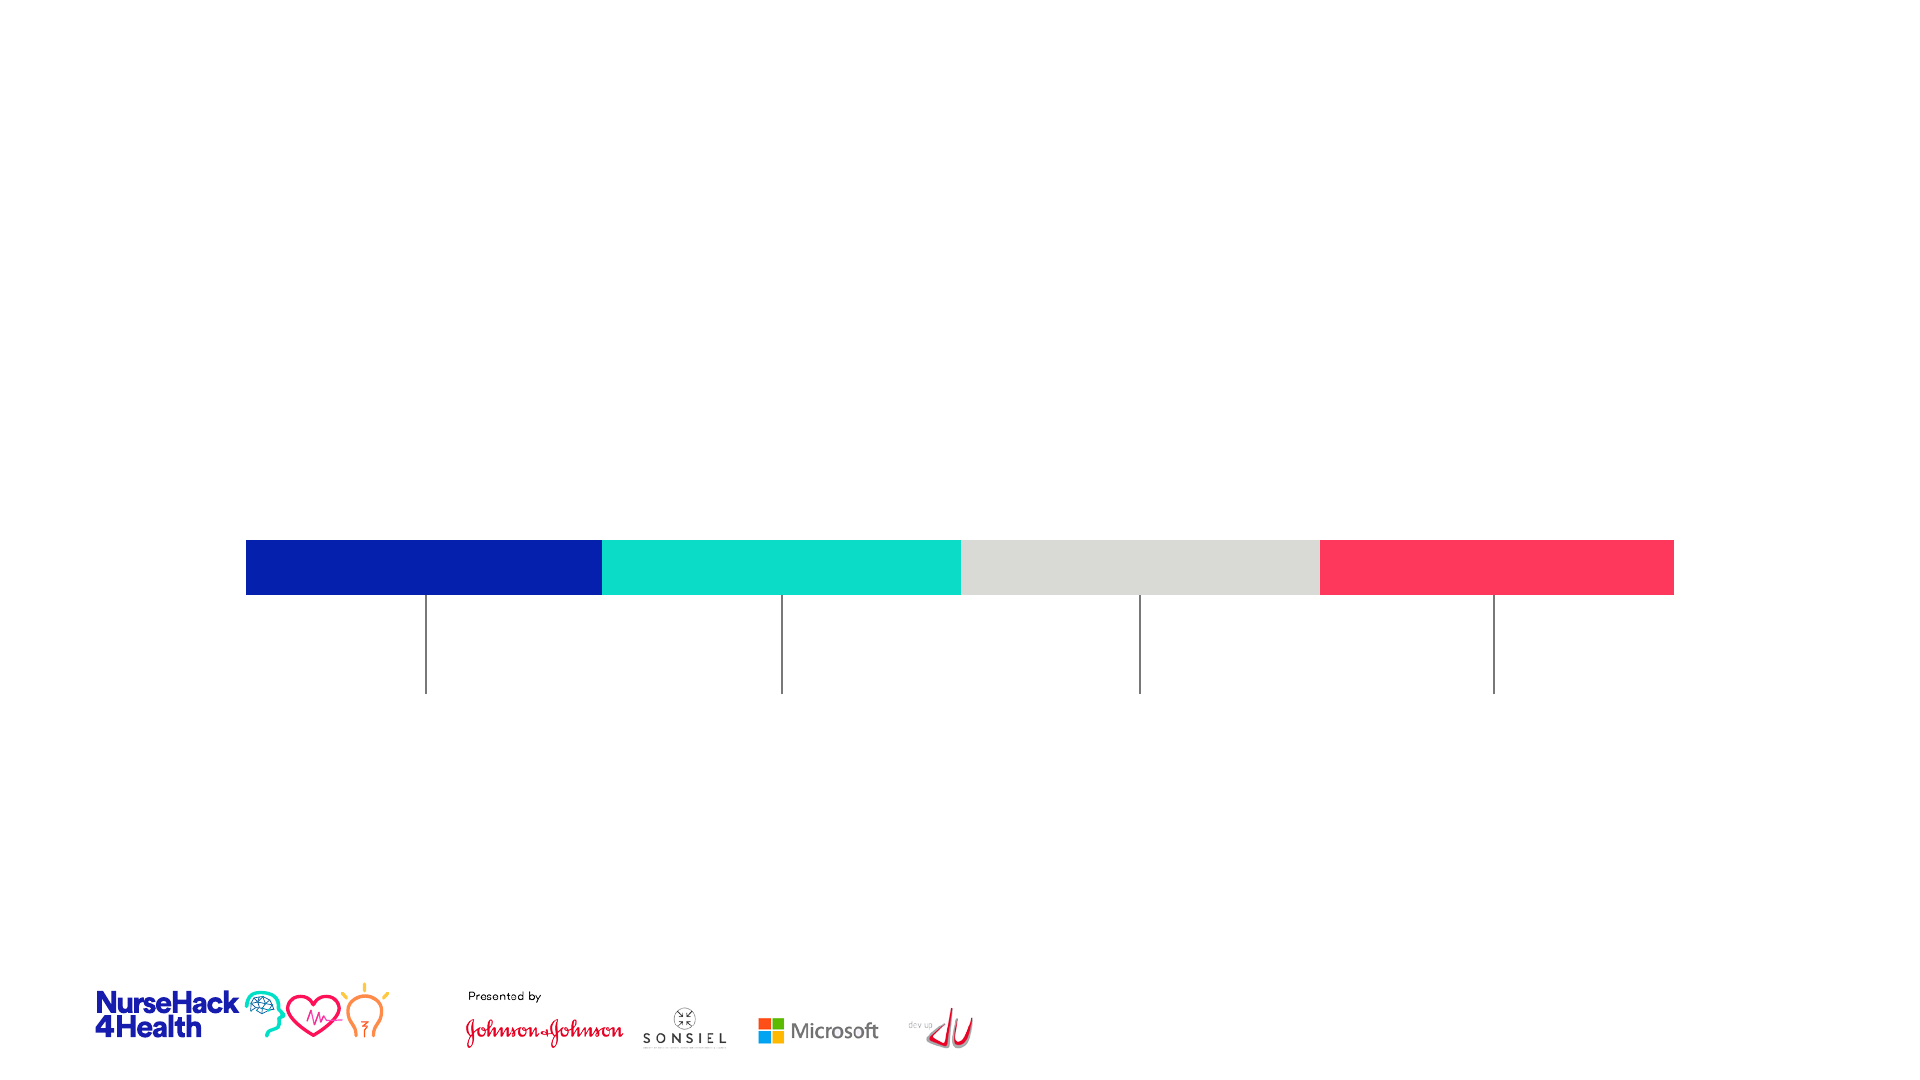
33
Timeline Overview
Deliverable 1
Additional info
Deliverable 2
Additional info
Phase 1
Description
Deliverable 3
Additional info
Phase 2
Description
Phase 3
Description
Phase 4
Description
Deliverable 4
Additional info

Venn Diagram
34
Topic 2Topic 1
• Text goes here
• Text goes here
• Text goes here
• Text goes here
• Text goes here
• Text goes here
• Text goes here
• Text goes here
• Text goes here
Topic 3
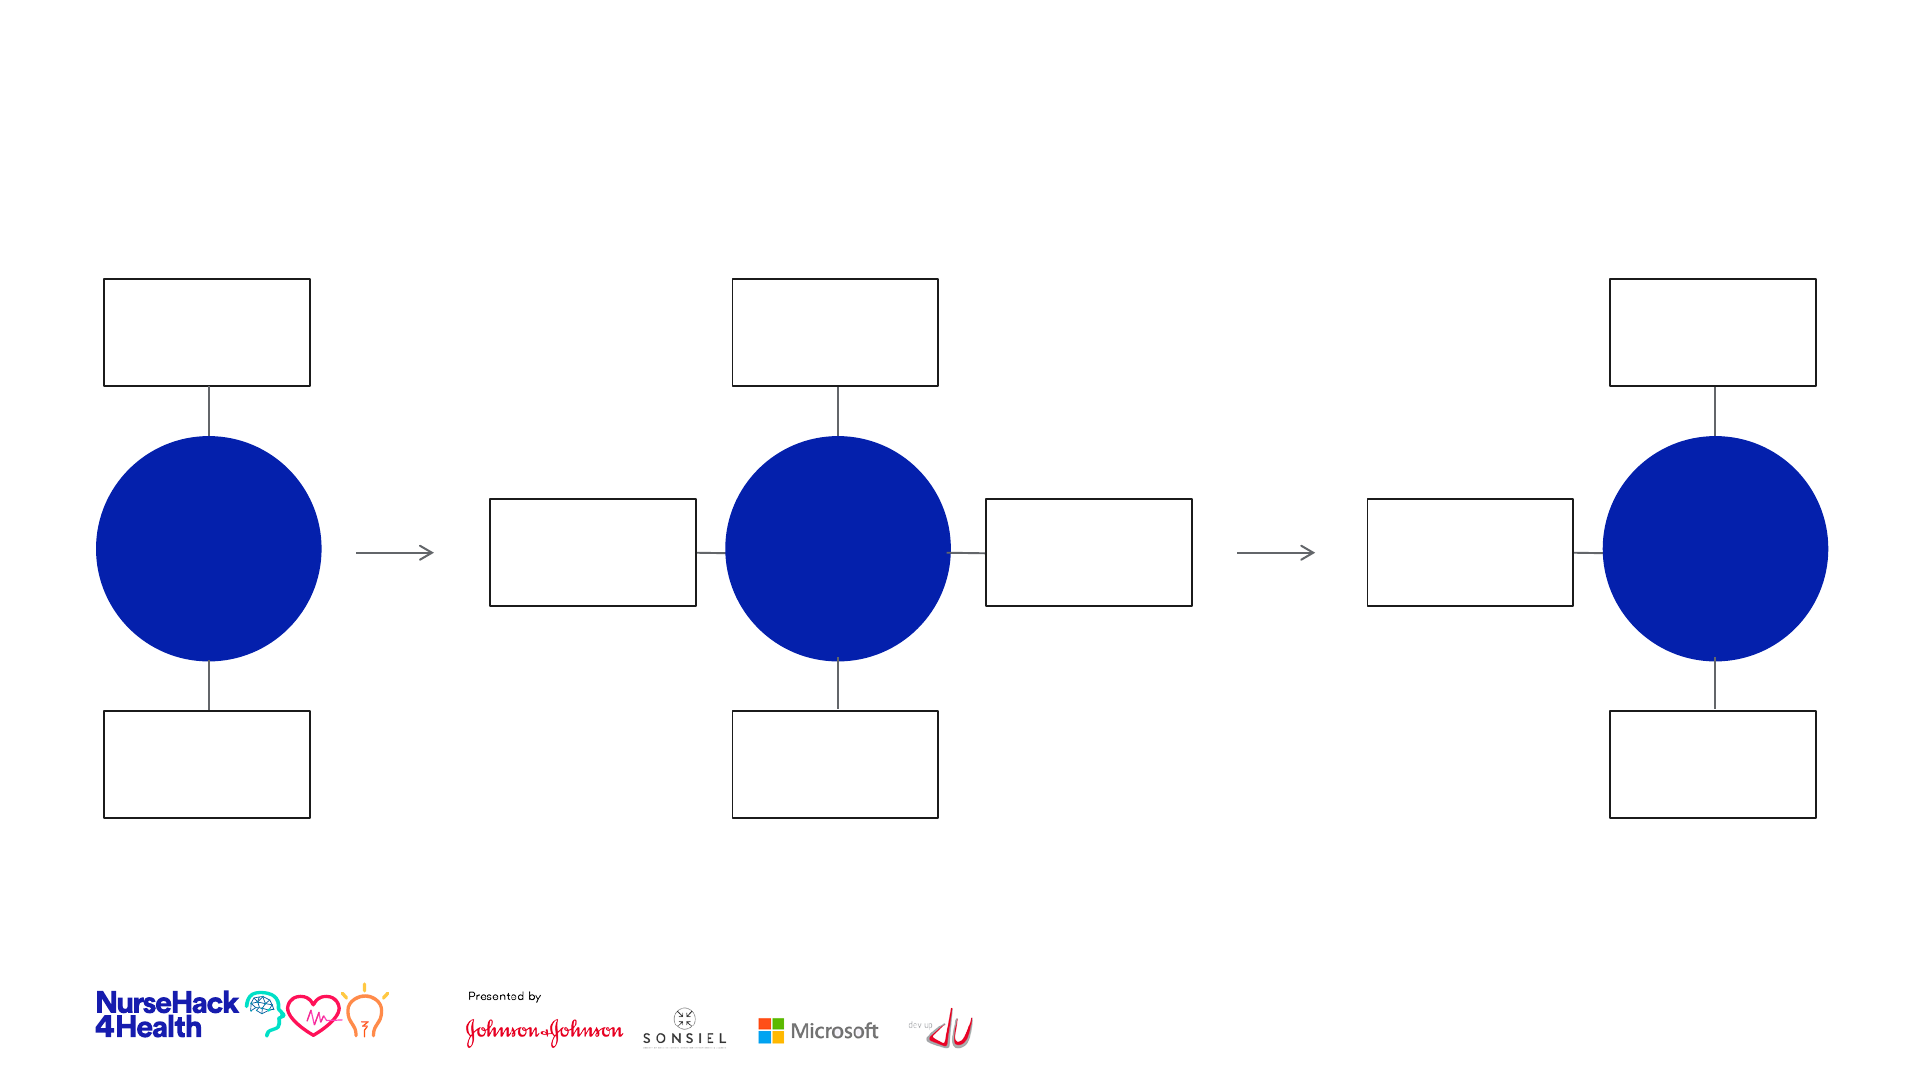
Process Map
35
Activity name
Phase
1
Activity name
Phase
2
Activity name
Activity name
Activity name Activity name
Phase
3
Activity name
Activity name
Activity name
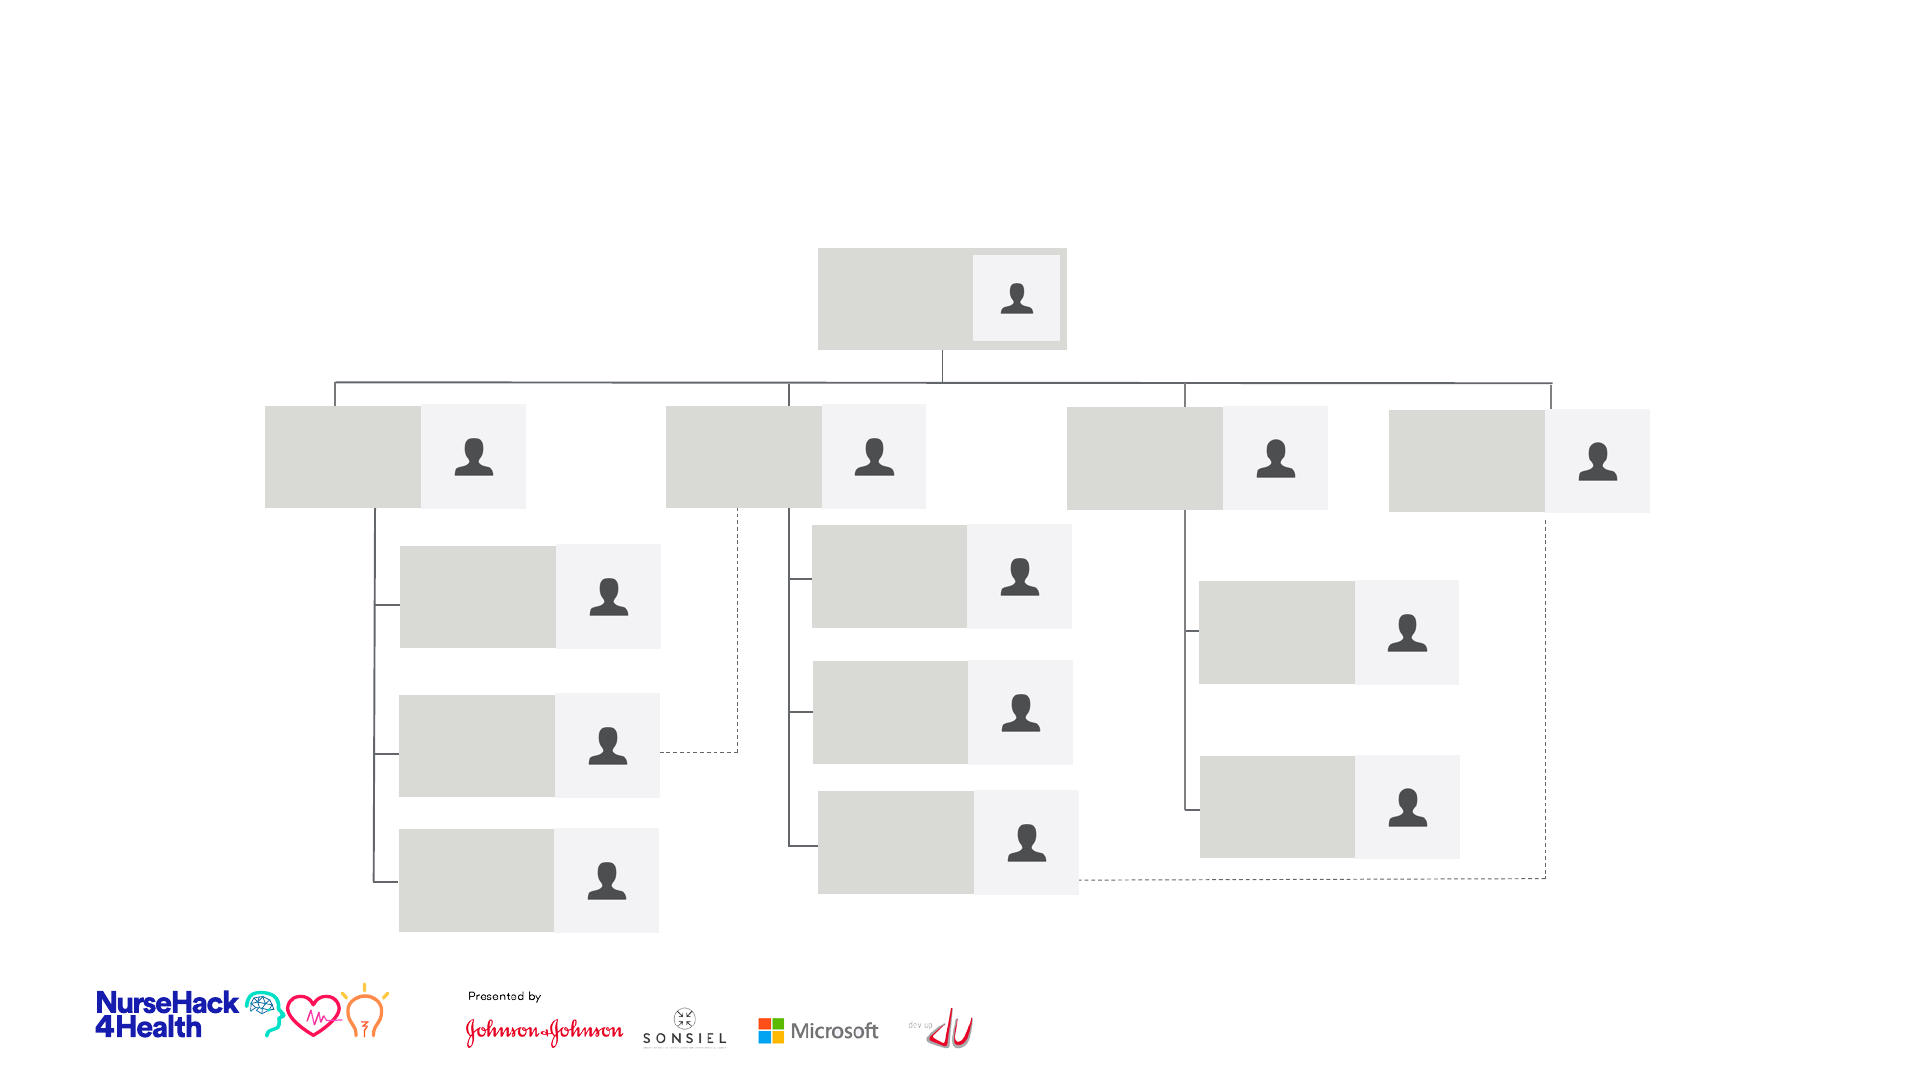
36
Organizational Chart
Name Lastname
Title
Description
here…
Name Lastname
Title
Description
here…
Name Lastname
Title
Description
here…
Name Lastname
Title
Description
here…
Name Lastname
Title
Description
here…
Name Lastname
Title
Description
here…
Name Lastname
Title
Description
here…
Name Lastname
Title
Description
here…
Name Lastname
Title
Description
here…
Name Lastname
Title
Description
here…
Name Lastname
Title
Description
here…
Name Lastname
Title
Description
here…
Name Lastname
Title
Description
here…
Use solid colors headers and row color variations to separate information. Change table colors
using the Table Design tab.
TOTAL COMPANY 2010 2009
% CHANGE
TOTAL OPS
Sales $61.6B $61.9B (0.5%) (1.3%)
Adjusted Earnings* $13.3B $12.9B 2.9%
Adjusted EPS* $4.76 $4.63 2.8%
Free Cash Flow** $14.0B $14.2B
37
Table Example A

Use solid colors headers and row color variations to separate information. Change table colors
using the Table Design tab.
TOTAL COMPANY 2010 2009
% CHANGE
TOTAL OPS
Sales $61.6B $61.9B (0.5%) (1.3%)
Adjusted Earnings* $13.3B $12.9B 2.9%
Adjusted EPS* $4.76 $4.63 2.8%
Free Cash Flow** $14.0B $14.2B
38
Table Example B
